|
||||
| Web Sites, Documents and Articles >> Hartford Courant News Articles > | ||
|
Hartford's Hive Of Busy Workers New U.S. Statistic Allows Productivity Comparisons By JANICE PODSADA, Courant Staff Writer October 11, 2007
Related Links
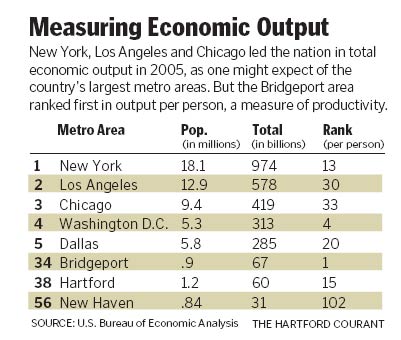
Measuring Economic Output
GRAPHIC In 2005, the metropolitan areas of San Antonio, Austin and Hartford had roughly the same economic output, defined as the total value of all goods and services produced there: $60 billion. But in terms of productivity per person, the Hartford metropolitan area, with 1.2 million people, beat the other two. At $50,839 per person, the Hartford area was more productive per person than San Antonio, whose population was 1.95 million, or Austin, with a population of 1.5 million. Until recently, the ability to compare the productivity of one metropolitan area to another was difficult, if not impossible. This fall, however, the U.S. Bureau of Economic Analysis, a division of the Department of Commerce, introduced a new statistic: gross domestic product (GDP) by metropolitan statistical area (MSA). Its debut has made it possible to compare and rank metropolitan areas by their per capita productivity and economic output, and to analyze the economic growth rate of an MSA or to compare the growth rate of the nation's 363 MSAs. Total output data is available for the years 2001 through 2005 for 363 MSAs in the nation. An MSA is typically defined as a county-based region with at least one urban area of 50,000 or more people and economically related territories - such as Hartford, East Hartford and West Hartford, according to the U.S. Office of Management and Budget. "This statistic is something that is going to be used by a lot of people," said Peter M. Gioia, an economist with the Connecticut Business and Industry Association and a member of the governor's new eight-member economic advisory panel. "It will allow better metro-to-metro comparison. It can be used to compare the metro area to how the state is doing, how the nation is doing," Gioia said. There are three metropolitan statistical areas in Connecticut: the Bridgeport-Stamford-Norwalk MSA (population 900,500); the New Haven-Milford MSA (population 845,000) and the Hartford-West Hartford-East Hartford MSA (population 1.2 million). The Bridgeport metro area topped the nation in terms of productivity - $74,650 per person; while Silicon Valley, which includes San Jose, Sunnyvale and Santa Clara (population 1.7 million), ranked second in per-person productivity at $70,758. In addition, each metropolitan area's economic output is broken down into more than 60 economic sectors and sub-sectors, including agriculture, mining, manufacturing, educational services, and arts and entertainment. The various categories allow a metropolitan area to compare the size, scope and health of its economic sectors over time, as well as the ability to compare its economic base to that of other metropolitan areas. In 2005, for example, Hartford's finance and insurance sector produced about $15 billion worth of goods and services vs. $5.5 billion for San Antonio and $3.5 billion for Austin. On the other hand, Hartford's technology, information and communication sector, which produced $1.7 billion in goods and services in 2005, was less robust than Austin's technology sector, whose 2005 output was $9.8 billion. The new statistic should come in handy as a measure of internal MSA growth, said state labor economist John Tirinzonie of the Connecticut Department of Labor and also a member of the governor's economic advisory panel. "We wouldn't use them to compare ourselves to other parts of the nation," Tirinzonie said. "I think we would look at the numbers more in terms of internal comparisons - how an area's GDP is growing compared to the state or how it's growing year by year." In 2005, real economic output grew in 327 of the 363 metropolitan areas. In 2005, the nation's total economic output was approximately $12.4 trillion. California contributed $1.6 trillion to the total. The New York metropolitan area's contribution was $1.1 trillion. Metropolitan areas produced 90 percent of the nation's economic output in 2005. And the five largest metropolitan areas accounted for almost 25 percent of the nation's total. The smallest 75 metropolitan areas produced less than 2 percent of the nation's total economic output. The Commerce Department plans to release the new statistic - gross domestic product by metropolitan statistical area - on an annual basis each fall. To see Gross Domestic Product by Metropolitan Areas go to: http://www.bea.gov/regional/gdpmetro/
|
||
| Last update:
September 25, 2012 |
|
||

|